Cloud computing operates under a shared responsibility model, blending vendor-provided tools and procedures with customer-managed configurations. To ensure consistent practices across autonomous teams and maximize the benefits of cloud computing — while minimizing data duplication and telemetry noise — it is imperative to establish clear standards and best practices for observability. These standards will help organizations:
- Effectively capture logs.
- Define baseline operating metrics.
- Analyze telemetry data consistently.
This blog provides guidelines for enhancing the observability of compute resources by:
- Defining essential monitoring metrics.
- Establishing best practices for logging and tracing.
- Providing recommendations for alerting and anomaly detection.
- Highlighting visualization strategies for dashboards to aid in monitoring, troubleshooting, and decision-making.
The Importance of Observability
Observability — the ability to understand a system’s behavior by collecting metrics, logs, and traces — is essential for maintaining the health of workloads and applications in the cloud. It enables proactive event responses and informed decision-making, ultimately maximizing reliability and availability.
Shifting Responsibilities in the Cloud
Traditionally, operations teams observed all layers of the computing stack. With cloud computing, service providers manage lower-level components (infrastructure, network, service availability), while customers focus on application-level monitoring. This shift requires updated practices tailored to the chosen compute options, ensuring that observability remains robust and cost-effective.
For example, teams using containers may integrate tools like CloudWatch Container Insights, but must evaluate whether additional tools genuinely enhance capabilities or introduce unactionable noise. AWS services like CloudWatch Logs provide default functionality, and introducing redundant tools can increase costs without tangible benefits.
The absence of effective observability can lead to:
- Longer Mean Time to Recovery (MTTR): Prolonged recovery from incidents.
- Higher Costs and Overheads: Increased support and management efforts.
- Increased Failure Rates: Reduced system reliability.
- Lower Service Availability: Delays in issue detection and resolution.
- Limited Data for Decision-Making: Hindered performance and reliability insights.
- Longer Change Management Windows: Slower evaluation of system changes.
Observability Principles
To achieve effective observability, follow these core principles:
- Intentional Data Collection: Focus on metrics, logs, and traces to provide a holistic view of system behavior. Collect data that is meaningful and aligns with the organization’s goals.
- Actionable Telemetry: Ensure that all collected data leads to targeted alerts, well-defined dashboards, and actionable insights. Unnecessary noise should be minimized to prevent alert fatigue.
- Proactive Monitoring: Build mechanisms to detect issues before they impact end users. This includes setting thresholds, anomaly detection, and predictive analytics to identify trends and potential issues early.
- Accessible Data: Make telemetry data easily available and consumable through well-integrated systems. Provide stakeholders with access to dashboards, reports, and tools that support decision-making.
- Collaboration Across Teams: Encourage teams to work collaboratively by sharing telemetry data and insights. Observability should foster cross-functional understanding between developers, operators, and business stakeholders.
- Iterative Improvement: Continuously refine observability practices based on feedback, evolving technology, and changing business needs. Observability is not static; it should evolve with the system it monitors.
Key Observability Components
Metrics
Quantifiable measurements that reflect system performance.
Best Practices:
- Define thresholds aligned with SLAs (e.g., performance, availability).
- Instrument telemetry across applications, workloads, dependencies, and user activity.
- Use custom and composite metrics where built-in metrics fall short.
- Employ visualization tools to identify trends and patterns.
- Use relational queries for deeper metric analysis.
Logs
Detailed records of events within systems.
Best Practices:
- Use approved tools (e.g., CloudWatch Logs, Splunk) for centralized log management.
- Adopt structured logging formats like JSON or EMF for easier parsing and analysis.
- Include relevant metadata (timestamps, request IDs, error codes).
- Standardize logging frameworks for consistency.
- Use visualization tools like Kibana or Grafana for log exploration.
- Set log retention periods based on compliance needs.
Traces
End-to-end records of transactions across system components.
Best Practices:
- Use tools like Amazon X-Ray or OpenTelemetry for tracing.
- Employ trace IDs to correlate transactions across services.
- Annotate traces with meaningful business and technical context.
Observability Strategies by Compute Type
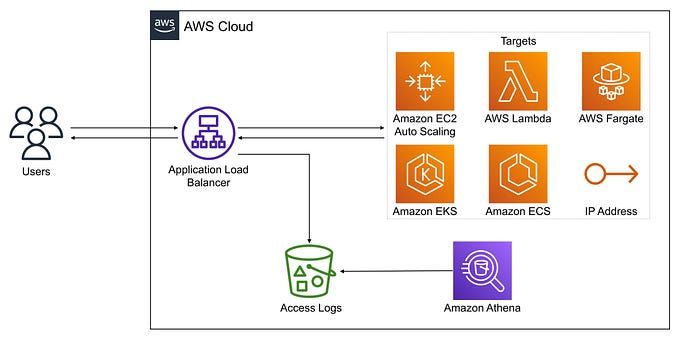
Amazon EC2
- Logging: Use CloudWatch Logs for log collection, analysis, and visualization.
- Metrics: Leverage CloudWatch Metrics to monitor CPU, disk, network, and custom metrics. Utilize dashboards for trend analysis.
- Tracing: Use AWS X-Ray for distributed tracing and performance optimization.
AWS Lambda
- Logging: Use CloudWatch Logs and AWS Lambda extensions for log management.
- Metrics: Use CloudWatch Lambda Insights for system-level metrics.
- Tracing: Enable AWS X-Ray for all functions to track and troubleshoot invocations.
Containers
- Logging: Use CloudWatch Logs and service mesh tools to manage ephemeral container nodes.
- Metrics: Leverage CloudWatch Container Insights for performance aggregation.
- Tracing: Install X-Ray daemons in container images for detailed tracing.
Recommendations for Visualization and Analytics
- Visualization Tools: Tools like Kibana, Grafana, or QuickSight can enhance insights into telemetry data by providing clear trends and patterns.
- Analytics: Focus on actionable analytics metrics. Use cloud-native or approved tools for deep exploration and insights.
By adhering to these observability principles and best practices, organizations can:
- Detect and resolve issues proactively.
- Ensure system reliability and availability.
- Gain actionable insights for informed decision-making.
Implementing robust observability practices is a critical step in managing cloud workloads effectively and maximizing the value of cloud computing investments.